In the previous section we covered scaling our WordPress pods in and out manually using kubectl. That can be quite useful at times, but in most production workloads you’ll usually want that to happen automatically, based on how much traffic you’re getting (or other criteria). That’s called auto-scaling.
Note: all code samples from this section are available on GitHub.
In this section we’ll install and configure the Kubernetes Metrics Server to monitor resource usage across nodes and pods. We’ll then configure a HorizontalPodAutoscaler resource to automatically adjust the number of our WordPress pods in the cluster, based on the CPU utilization across running pods. We’ll use a load testing tool to observe how this happens in real time.
Metrics Server
The Metrics Server for Kubernetes collects usage metrics from nodes and pods in a cluster, and exposes them through the Kubernetes API server. It’s designed primarily to serve auto-scaling configurations in Kubernetes (we’ll cover monitoring in a separate section).
Depending on the Kubernetes flavor you’ve chosen, Metrics Server may already be available in your cluster, or could be installed as an addon (in microk8s for example) so you may be able to skip the next few steps if you’re not running a vanilla cluster. You can check if it’s Metrics Server is running using:
$ kubectl top nodes
error: Metrics API not available
We’re running a vanilla Kubernetes cluster, so following the instructions in from the documentation, let’s install Metrics Server into our Kubernetes cluster:
$ kubectl apply -f https://github.com/kubernetes-sigs/metrics-server/releases/latest/download/components.yaml
This will pull down and add a few components to our cluster. Depending on your configuration, this may be all that’s necessary for Metrics Server to run, and you should be able to observe the node utilization:
$ kubectl top nodes
NAME   CPU(cores)   CPU%   MEMORY(bytes)   MEMORY%
k0     1991m        49%    1285Mi          72%
k1     1856m        23%    2361Mi          40%
k2     1797m        22%    1316Mi          22%
If you do get <unknown> values, a metrics not available yet error, or a ServiceUnavailable error, then there might be some additional configuration you’ll need to take care of.
To get more information on what’s wrong, let’s find our Metrics Server pod in the cluster and observe the logs from the pod:
$ kubectl -n kube-system get pods | grep metrics
metrics-server-7ffbc6d68-hn9wv     0/1     Running   0              19m

$ kubectl -n kube-system logs metrics-server-7ffbc6d68-hn9wv
E0711 11:25:59.863634       1 scraper.go:149] "Failed to scrape node" err="Get \"https://10.0.10.100:10250/metrics/resource\": tls: failed to verify certificate: x509: cannot validate certificate for 10.0.10.100 because it doesn't contain any IP SANs" node="k0"
This is quite a common scenario with vanilla Kubernetes, and there are several solutions to this, depending on your exact configuration.
TLS for Metrics Server
From the error message above, we can see that the Metrics Server is trying to scrape our nodes by their IP address, 10.0.10.100 in the example above. However, the x509 certificate generated for node (when joining the cluster), does not include that IP address.
We can verify that with OpenSSL:
$ ssh k0
$ openssl x509 -text -noout -in /var/lib/kubelet/pki/kubelet.crt
# (omitted output)
            X509v3 Subject Alternative Name:
                DNS:k0
The certificate is perfectly valid for the k0 DNS name, and we can ask Metrics Server to prefer the node Hostnames and not IPs. We can do this by editing the Metrics Server Deployment:
$ kubectl -n kube-system edit deployment/metrics-server
This opens up a text editor, where you can change the configuration. Note that saving and exiting the editor will apply the updated configuration directly into the Kubernetes cluster.
    spec:
      containers:
      - args:
        - --cert-dir=/tmp
        - --secure-port=10250
        - --kubelet-preferred-address-types=InternalIP,ExternalIP,Hostname
        - --kubelet-use-node-status-port
        - --metric-resolution=15s
        image: registry.k8s.io/metrics-server/metrics-server:v0.7.1
The --kubelet-preferred-address-types argument is the one we’re interested in. The default Metrics Server installation will prefer the InternalIP, and we can change that to Hostname to solve the TLS problem. However, do note that the hostname must be resolvable wherever the Metrics Server is running.
In our case k0, k1 and k2 are utility /etc/hosts entries on or control computer, but otherwise not resolvable within the cluster itself, so we’ll need to look for a different option, i.e. getting TLS certificates that cover the IP addresses.
It would be tedious to do this manually for all nodes, and for any new nodes that join the cluster later, or happen to change the IP address. Luckily Kubernetes has tools and APIs to solve this and you can read more about it Kubelet TLS bootstrapping.
For our configuration, we need to add serverTLSBootstrap to our Kubelet configuration on each node and restart them:
$ ssh k0
$ echo "serverTLSBootstrap: true" | sudo tee -a /var/lib/kubelet/config.yaml
$ sudo systemctl restart kubelet
After repeating this for every node in the cluster, you should see that each node has posted a certificate signing request with the cluster:
$ kubectl get csr
NAME        AGE    SIGNERNAME                      REQUESTOR        REQUESTEDDURATION   CONDITION
csr-2mwrn   1s     kubernetes.io/kubelet-serving   system:node:k2   <none>              Pending
csr-zj9sm   119s   kubernetes.io/kubelet-serving   system:node:k0   <none>              Pending
csr-zsx66   27s    kubernetes.io/kubelet-serving   system:node:k1   <none>              Pending
Let’s approve these CSRs and have a look at the resulting certificate on one of the nodes:
$ kubectl certificate approve csr-2mwrn csr-zj9sm csr-zsx66
certificatesigningrequest.certificates.k8s.io/csr-2mwrn approved
certificatesigningrequest.certificates.k8s.io/csr-zj9sm approved
certificatesigningrequest.certificates.k8s.io/csr-zsx66 approved

$ ssh k0
$ sudo openssl x509 -text -noout -in /var/lib/kubelet/pki/kubelet-server-current.pem
# (output ommitted)
            X509v3 Subject Alternative Name:
                DNS:k0, IP Address:10.0.10.100
This newly generated and signed certificate now has an IP Address as part of its SAN configuration, which means it is perfectly valid for our Metrics Server. Any new nodes that join the cluster later can also utilize TLS bootstrapping to request a similar certificate.
If this has not worked for you, or if you don’t want to fiddle with TLS certificates, as a last resort and in testing environments only, you can use the --insecure-skip-tls-verify argument in the Metrics Server deployment, to ignore the TLS errors. Note that this is insecure and should never be used in production.
Horizontal Pod Autoscaler
Now that we got our Metrics Server up and running, let’s create an auto-scaling configuration for our WordPress application.
The Horizontal Pod Autoscaler is a Kubernetes component which runs intermittently (every 15 seconds by default). It fetches resource metrics from the Metrics API in Kubernetes, and determines if the configured deployment needs more replicas, less replicas, or no change.
The CPU metric is by far the most common one to scale on. It’s not always the most reliable (for IO-bound workloads for example) but web applications such as WordPress are overall good fits. We’ll look at scaling using other and composite metrics in another section, but in this section we’ll focus only on CPU.
The way auto-scaling works is quite simple. We define a target metric value, for example 50% CPU utilization, and our HPA configuration will compare that to the actual utilization across all running pods. If the utilization is lower than 50%, it will terminate some replicas. If it’s more than 50% it will start some new replicas.
It’s worth noting that CPU utilization can exceed 100%, depending on the container requests and limits. If you recall from our previous section section, we’ve defined a 100m request for CPU for our WordPress container, with a 200m CPU limit. In this case, using 200m of CPU will cause 200% utilization. This gap between the resource request and its limit can allow more accurate/aggressive scaling decisions.
Creating a Horizontal Pod Autoscaler
If you’ve been following our guide so far, you should have a running WordPress deployment that is stateless, alongside a MariaDB and MinIO stateful sets, both configured on replicated OpenEBS volumes.
Let’s create a new wordpress.hpa.yml maifest:
apiVersion: autoscaling/v2
kind: HorizontalPodAutoscaler
metadata:
  name: wordpress
spec:
  minReplicas: 1
  maxReplicas: 20
  metrics:
  - resource:
      name: cpu
      target:
        averageUtilization: 80
        type: Utilization
    type: Resource
  scaleTargetRef:
    apiVersion: apps/v1
    kind: Deployment
    name: wordpress
The minReplicas and maxReplicas are lower and upper bounds for how many WordPress pods we would like to be running. The metrics section tells Kubernetes to scale on the cpu metric, and attempt to maintain 80% average utilization. The scaleTargetRef tells Kubernetes which component will need to be scaled, in our case it’s the WordPress deployment.
Let’s add this manifest to our Kubernetes cluster and observe the new resource:
$ kubectl apply -f wordpress.hpa.yml
horizontalpodautoscaler.autoscaling/wordpress created

$ kubectl get hpa
NAME        REFERENCE              TARGETS       MINPODS   MAXPODS   REPLICAS   AGE
wordpress   Deployment/wordpress   cpu: 2%/80%   1         20        1          2m26s
In the example above we’re seeing only 2% utilization out of the 80% target, and since the deployment is already running at its minimum, nothing is going to change. Let’s fire up our Oha load testing utility and see if we can move the needle:
$ oha -n 100000 --disable-keepalive http://k0:30007/
# Don't forget to disable keepalive!

$ kubectl get hpa
NAME        REFERENCE              TARGETS         MINPODS   MAXPODS   REPLICAS   AGE
wordpress   Deployment/wordpress   cpu: 135%/80%   1         20        1          7m44s

$ kubectl top pods
NAME                         CPU(cores)   MEMORY(bytes)
mariadb-0                    19m          129Mi
minio-0                      2m           149Mi
wordpress-756d97c644-6clgt   203m         104Mi
Soon enough you will see that new WordPress pods are being created up to the maximum number of replicas (or until the cluster resources limit is reached):
$ kubectl get pods
NAME                         READY   STATUS     RESTARTS       AGE
mariadb-0                    1/1     Running    5 (141m ago)   5d17h
minio-0                      1/1     Running    6 (141m ago)   6d17h
wordpress-756d97c644-4z6g9   2/2     Running    0              62s
wordpress-756d97c644-6clgt   2/2     Running    0              138m
wordpress-756d97c644-hkn2k   0/2     Init:0/1   0              2s
wordpress-756d97c644-wtkm5   0/2     Init:0/1   0              2s
You will also see from the Oha graphs how the number of requests served every minute is increasing as the WordPress deployment automatically scales out:
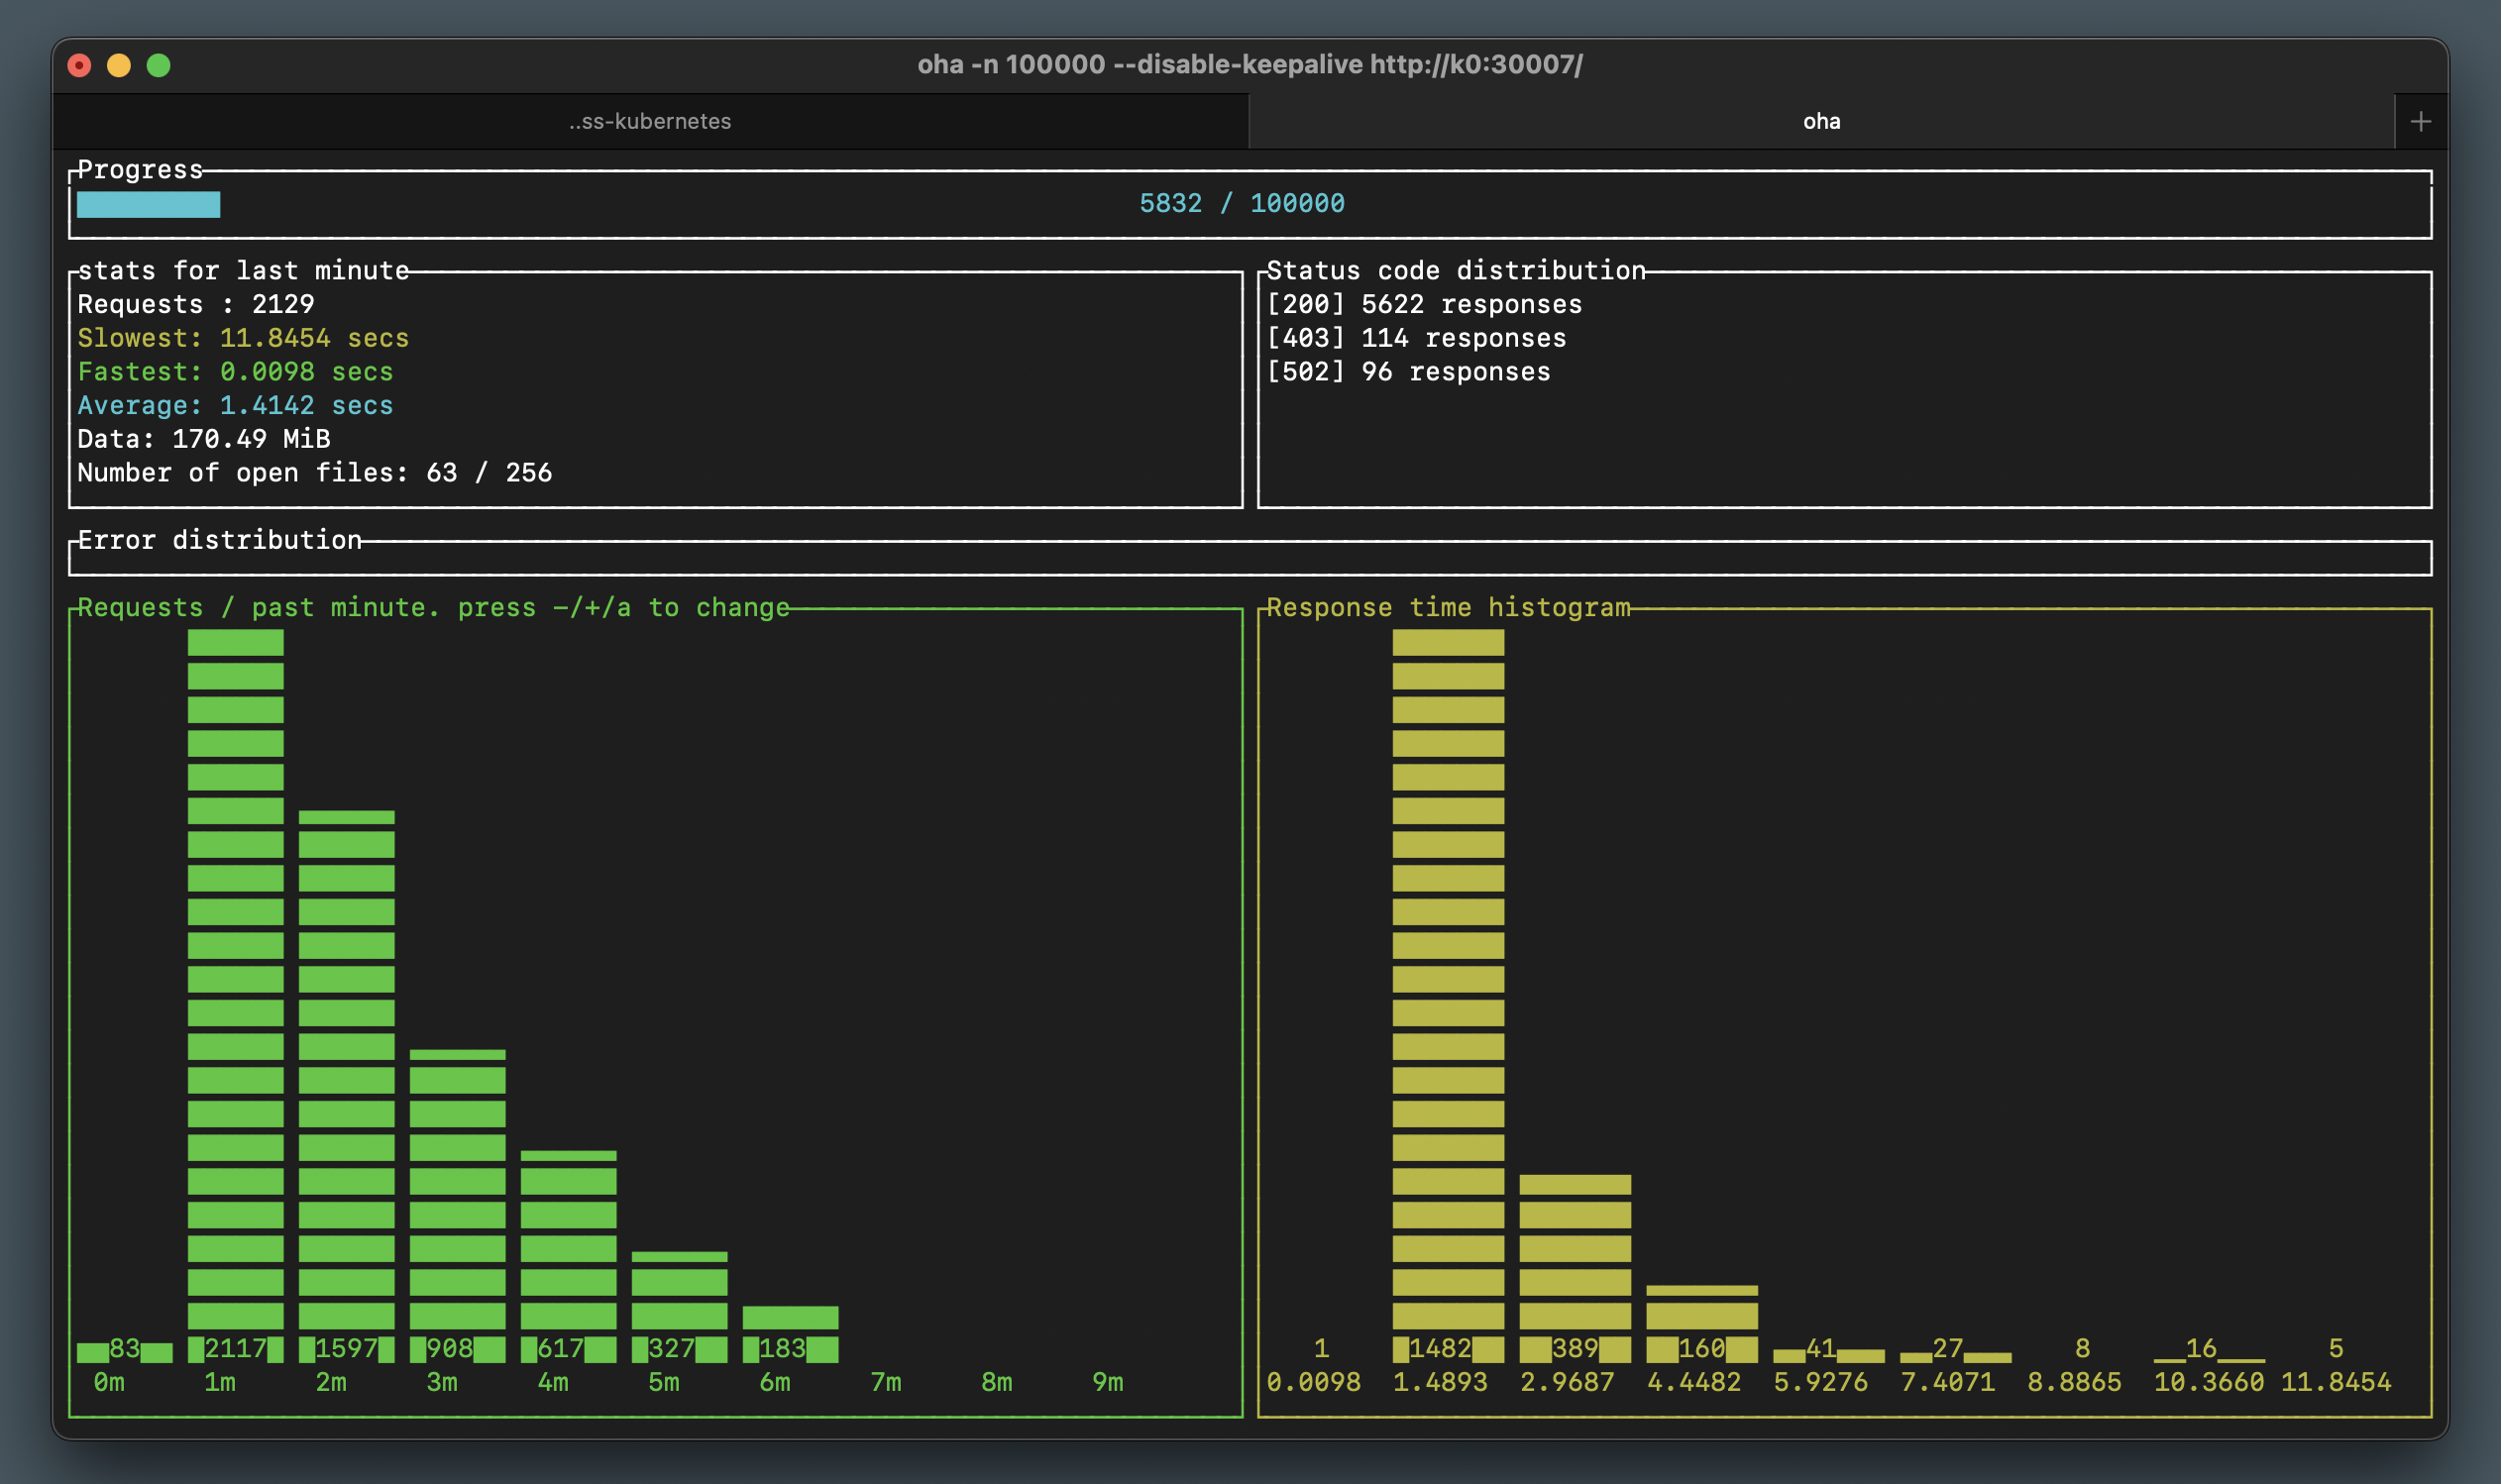
You may notice some 502 and 403 errors during scaling events. That happens because we have not defined any readiness/health checks for our containers, so our service may sometimes send some traffic to a pod that’s not ready to accept this traffic yet. We’ll look at health checks in a future section.
Interrupting the Oha load test with Ctrl+C will stop sending traffic to our WordPress site, but do note that by default it will take about five minutes for the deployment to scale back in and eventually get back to its minimum.
There are plenty of scaling behavior options that can be adjusted, including stabilization windows, check periods, scale up and down rates and more. We encourage you to try a few in your cluster to get some understanding of what’s available.
Scaling on CPU utilization makes sense for most web applications, but that is not the only option. We can scale on other metrics as well (or composite metrics), including incoming traffic. We’ll cover that when walking through Ingress in Kubernetes in later sections.
Limits and Requests
It’s also worth mentioning that the HPA metrics are compared to those reported by a pod, and not a specific container, which is why it’s important to provide accurate resource requests and limits for each container.
For example, in our WordPress deployment if we had specified a 500m CPU request (and limit) for our Nginx container, together with the WordPress container (100m) that would bring the Pod total CPU request to 600m. With that configuration, even if our WordPress container was being used at double its request (200m) that would only report ~ 30% utilization for the entire pod, and would never reach our auto-scaling threshold.
Use the kubectl top command to understand utilization across nodes, pods, and even containers:
$ kubectl top pods --containers
POD                          NAME        CPU(cores)   MEMORY(bytes)
mariadb-0                    mariadb     1m           165Mi
minio-0                      minio       2m           149Mi
wordpress-756d97c644-6clgt   nginx       0m           16Mi
wordpress-756d97c644-6clgt   wordpress   1m           69Mi
This is incredibly useful in debugging auto-scaling configurations.
Recap
In this section we installed Metrics Server into our Kubernetes cluster and created an auto-scaling policy for our WordPress deployment based on the pod’s CPU utilization. We launched an HTTP load testing utility to observe the automatic scaling happening in real time.
In the next few chapters we’re going to look at our next single point of failure – the database. We’ll discuss redundancy, replication and scaling. See you there!