The moment you’ve been waiting for. In this section we’re going to scale our Kubernetes WordPress deployment out to 20 running pods. We’re going to look at resource limits and requests, and scale our pods out while running a simple HTTP load test.
Note: all code samples from this section are available on GitHub.
Requests and Limits
Until now, every pod we’ve launched into our Kubernetes cluster had no resource requests or limits. This means that the underlying node would not specifically limit the running containers in any way, but that does still mean that the containers are subject to any limits on the nodes themselves, such as the amount of physical RAM available on the system.
To make sure things run smoothly and are scheduled in a balanced manner across the cluster, it is always a good idea to provide resource requests and limits for any pods we plan to run. It is also a requirement for auto-scaling as you will see in a later section.
The most often resources you’ll be requesting and limiting are cpu and memory. CPU is measured in “CPU units” where 1.0 is equivalent to a full single core, so 10% of a CPU core would be 0.1 units, or 100m. Memory is measured in bytes of course.
A request tells the Kubernetes cluster how much CPU or memory has to be available to run your container. A limit allows your container to use more than it requested, if available. Requests and limits are defined per-container in the deployment (or other abstraction) manifest.
When scheduling a pod, Kubernetes will reserve the requested resources for your containers. If there are not enough resources, the pods may be stuck in pending state, until more capacity is added, or some capacity is freed from other pods in the cluster.
It is quite common to assume that a 4GB Kubernetes node will have around 4GB available for our pods, but the reality may be quite different, depending on your configuration, and will typically vary from provider to provider too with managed Kubernetes.
We can use kubectl to find out how much capacity each node in our cluster has:
$ kubectl describe node k0
# (omitted output)
Capacity:
  cpu:                4
  ephemeral-storage:  51287520Ki
  hugepages-2Mi:      2Gi
  memory:             4009412Ki
  pods:               110
Allocatable:
  cpu:                4
  ephemeral-storage:  47266578354
  hugepages-2Mi:      2Gi
  memory:             1809860Ki
  pods:               110
In the case above on our 4GB virtual machine, only ~ 1.8G of memory is available for our pods (not uncommon with hugepages). In the same output we can find a summary of all allocated resources for the given node, as well as a full breakdown of all running pods and their requests/limits.
We’ll also take a quick look at the Kubernetes Metrics Server in the next section, but these numbers should give you a good understanding of the current available and reserved capacity in a cluster.
Requests & Limits for WordPress
There is no one-size-fits-all approach when it comes to WordPress applications unfortunately – rightsizing one is a mix between art and science. There are few things we can measure, but usually it’s mostly guesswork and a lot of testing.
The official WordPress image on DockerHub comes with a PHP-FPM configuration setting of pm.max_children = 5 meaning it will spawn up to five worker processes. An empty vanilla WordPress installation will consume about 5MB of memory per request, so to support 5 concurrent requests, we’ll need at least 25M for the worker processes, plus a few megabytes for the master process and our TCP backlog. Throw in a typical WooCommerce installation and this “math” easily gets us to ~ 1.2 GB for one container.
Of course requesting 1.2 GB for our WordPress container would be overkill, even for a heavy WooCommerce application. Plus the chances of actually receiving 5 concurrent requests where each one consumes 256M of RAM is very low. Query Monitor will tell you how much memory each requests consumed.
Our recommended approach is to start as low as possible and see if you hit any memory limits with some test traffic, then continue monitoring with real traffic and adjusting (requests, limits, number of workers or pods) where necessary. If your pod is hitting the memory limit, you’ll see an OOMKilled status and a pod restart. That would be a signal to tune the limits.
We’re running a pretty empty WordPress site, so we’ll request 48Mi of memory, along with 100m of CPU which is 10% of one CPU core:
      containers:
      - name: wordpress
        image: wordpress:6.5.5-fpm
        resources:
          requests:
            cpu: 100m
            memory: 48Mi
          limits:
            cpu: 200m
            memory: 96Mi
We’ve also defined a limits section with double the requested CPU and memory, just in case we get a ton of traffic, and maybe install a plugin or two. Let’s also define requests and limits for our Nginx container:
      - name: nginx
        image: nginx:1.27.0
        resources:
          requests:
            cpu: 50m
            memory: 16Mi
          limits:
            cpu: 100m
            memory: 32Mi
Nginx is quite unlikely to ever become our bottleneck with this configuration, but we’ll still allow it to use up to 10% of a CPU core with a reserved 5%.
The total reservation for this entire pod will be 150m of CPU and 64Mi of memory. These are the numbers Kubernetes will use when looking for a node to place (or scale) your pods.
Let’s apply this configuration and make sure our WordPress pod is up and running with its new requests and limits:
$ kubectl apply -f wordpress.deployment.yml
deployment.apps/wordpress configured

$ kubectl get pods -o wide
NAME                         READY   STATUS    RESTARTS       AGE     IP            NODE   NOMINATED NODE   READINESS GATES
mariadb-0                    1/1     Running   3 (167m ago)   3d17h   10.10.3.20    k1     <none>           <none>
minio-0                      1/1     Running   4 (167m ago)   4d18h   10.10.3.151   k1     <none>           <none>
wordpress-756d97c644-fxxl9   2/2     Running   0              4m34s   10.10.3.35    k1     <none>           <none>
We can now describe our node to see how the WordPress pod affects our capacity:
$ kubectl describe node k1
# ...
Non-terminated Pods:          (12 in total)
  Namespace                   Name                              CPU Requests  CPU Limits  Memory Requests  Memory Limits  Age
  ---------                   ----                              ------------  ----------  ---------------  -------------  ---
  default                     mariadb-0                         0 (0%)        0 (0%)      0 (0%)           0 (0%)         3d17h
  default                     minio-0                           0 (0%)        0 (0%)      0 (0%)           0 (0%)         4d18h
  default                     wordpress-756d97c644-fxxl9        150m (1%)     300m (3%)   64Mi (1%)        128Mi (2%)     5m39s
You’ll also see the allocation percentages according to the resources available on this particular node, which may help with capacity planning.
Load Testing & Scaling
Before running a bunch of WordPress pod replicas, it’s useful to run some load testing tools to establish a baseline for a single pod. There’s plenty of great software and services out there for load testing, Apache Bench, JMeter, Hey, Grafana k6 just to name a few.
Our favorite though, for simple use cases, is oha. Oha runs in the terminal and shows you visually what’s happening in real time, including the number of requests, and a response time histogram. This is incredibly useful especially when testing while scaling as you will see shortly.
With the above limits and requests, let’s send a bunch of HTTP requests to our WordPress home page with Oha:
$ oha -n 100000 --disable-keepalive http://k0:30007/
This will perform 100,000 requests to our WordPress pods, and you can interrupt it at any time with Ctrl+C.
Note the --disable-keepalive flag. This is needed because of the way service load balancing works in Kubernetes. Without this flag, all Oha workers will re-use already established TCP connections to a pod, potentially preventing test traffic from reaching new pods in a service. You can read more about keep-alive in Kubernetes.
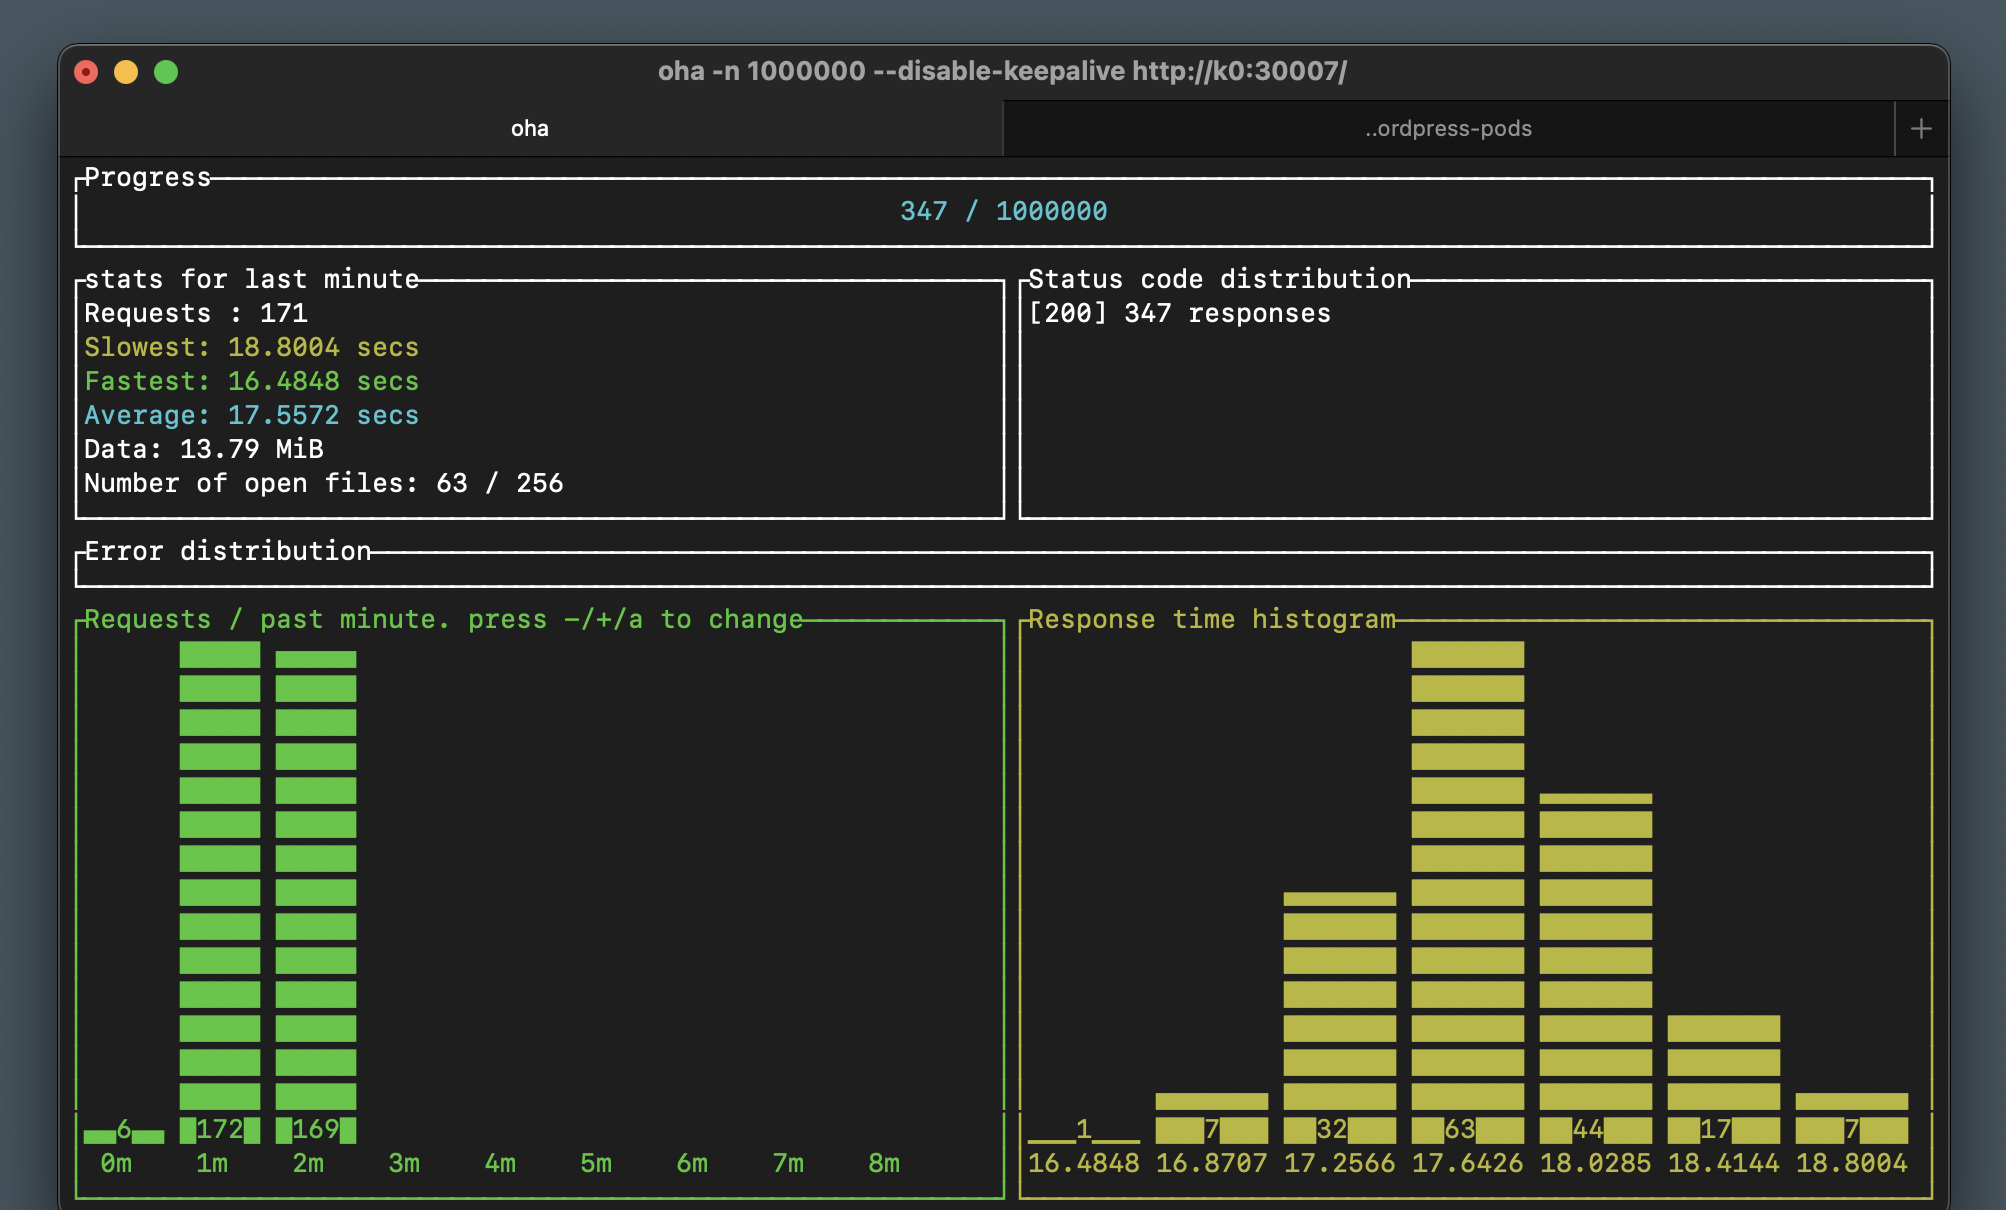
Sending this much traffic to a single pod with a 20% single-CPU limit is not going to be quick. In our tests we maxed out at about 170 requests per minute, with a 17 second request average. Let’s add a second pod and see how that affects our load test:
$ kubectl scale deploy/wordpress --replicas=2
deployment.apps/wordpress scaled
In a few seconds you’ll see the second pod online and running. In our tests, the per-minute request rate climbed to about 320, with the response time cut in approximately half. Why stop here?
$ kubectl scale deploy/wordpress --replicas=4
deployment.apps/wordpress scaled

$ kubectl get pods
NAME                         READY   STATUS    RESTARTS        AGE
mariadb-0                    1/1     Running   3 (4h25m ago)   3d19h
minio-0                      1/1     Running   4 (4h25m ago)   4d20h
wordpress-756d97c644-b8f44   2/2     Running   0               9m18s
wordpress-756d97c644-c6s99   2/2     Running   0               7m20s
wordpress-756d97c644-fxxl9   2/2     Running   0               102m
wordpress-756d97c644-kdnv9   2/2     Running   0               7m20s
Again, the response time should be cut in approximately half, and the request rate climbed to about 560 per minute.
There are reasons why you’re unlikely to get double the performance when doubling the capacity, but we won’t be discussing those in this section. Instead, let’s increase our capacity to 20 pods:
$ kubectl scale deploy/wordpress --replicas=20
deployment.apps/wordpress scaled
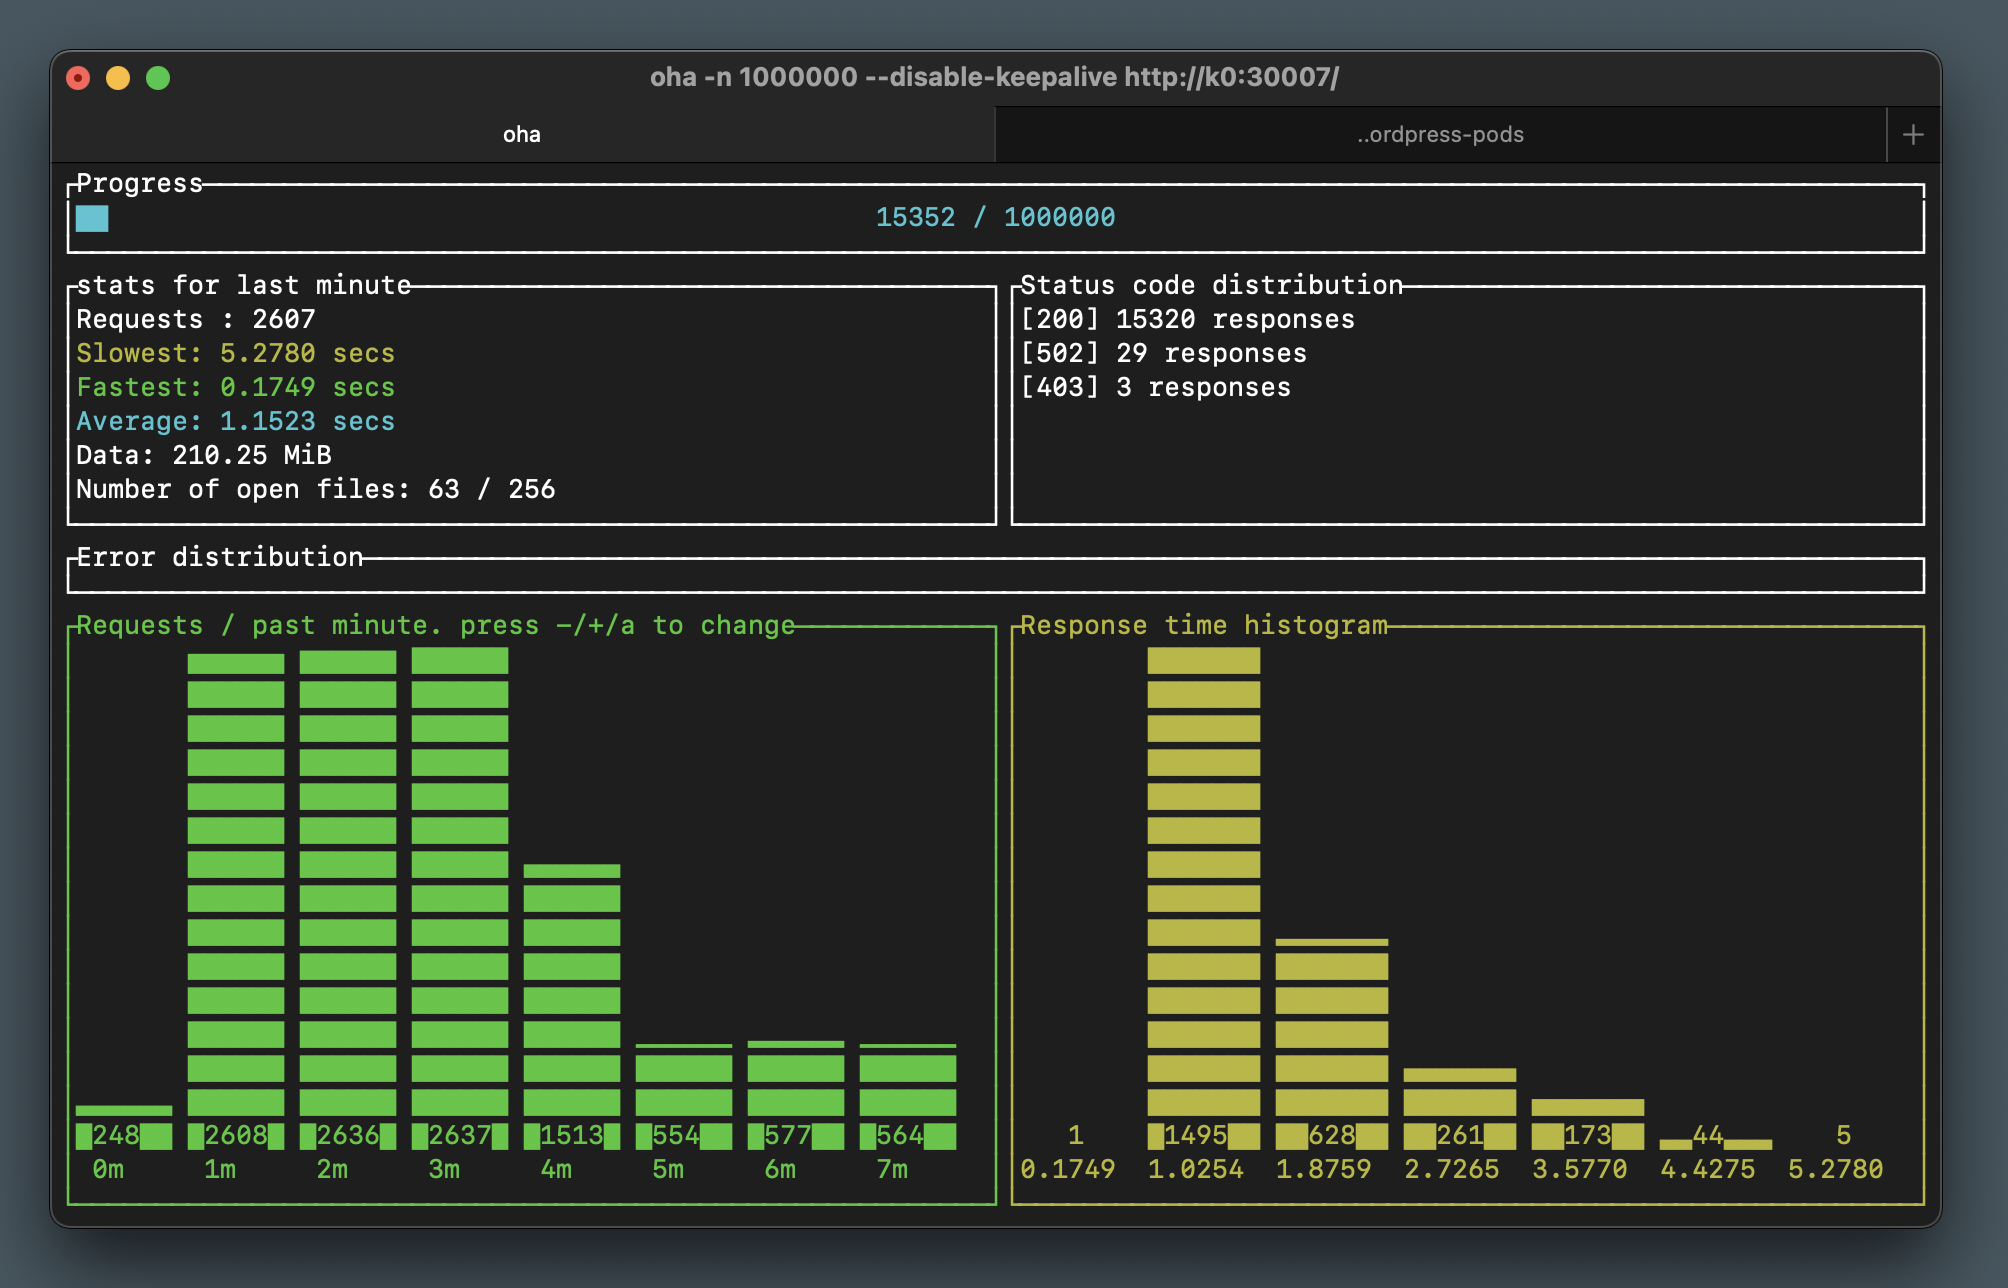
Peaks out about about 2600 requests per minute and quite a decent 1.1 second response time average. Feel free to keep going, provided you have the capacity!
You may notice some 502 and 403 HTTP errors when scaling out or in. This is due to the lack of health/readiness probing in our configuration, which allows Kubernetes to send traffic to a pod which may not be running PHP-FPM (or Nginx) yet. Don’t worry about it for now, we’ll look closer into health checks in a future section.
What’s next?
In this section we briefly covered resource requests and limits in Kubernetes, we’ve added both to our WordPress and Nginx pods, and used a load testing tool to visualize our performance while scaling our WordPress service to 20 pods.
It’s great to be able to quickly scale our service in and out, but doing it manually may not always be a great option. Sometimes you’ll want the ability to react to increase in demand automatically, and this is where Horizontal Pod Autoscaling (or HPA) comes in, which we’ll look at in the next section.